
The IPL Points Table tells the real story of every season — who won matches, who lost steam, and which team’s net run rate made the difference between a playoff spot and an early exit. It’s the single most important indicator of how consistent a franchise was across the league stage, and it ultimately decides who gets a shot at the title.
Across nineteen seasons, certain franchises have repeatedly found their way to the top of the standings — most notably Mumbai Indians and Chennai Super Kings. Meanwhile, Royal Challengers Bengaluru (RCB) currently hold the crown as the reigning IPL 2026 champions.
This article walks through every single IPL season, breaking down the final standings, key numbers, and the story behind each year’s table.
Who Is the Current IPL Champion?
Royal Challengers Bengaluru lifted their second consecutive title by winning IPL 2026. Under Rajat Patidar’s captaincy, RCB beat Gujarat Titans by 5 wickets in the final, played at the Narendra Modi Stadium in Ahmedabad.
This victory came right after RCB had ended a long-standing 17-year title drought in 2025. Going back-to-back in 2026 cemented their place as the team to beat that year. They also led the league-stage table with 18 points, carrying that form straight into the knockout rounds.
Joining them in the playoffs were Gujarat Titans, Sunrisers Hyderabad, and Rajasthan Royals — yet once again, Bengaluru proved unstoppable when the stakes were highest.
IPL Points Table — Every Season at a Glance (2008–2026)
Below is a season-by-season summary covering the table topper, total matches, wins, points, and final result for each year.
| Season | Table Topper | Matches | Wins | Points | Result |
| 2008 | RR | 14 | 11 | 22 | Champions |
| 2009 | DC | 14 | 10 | 20 | Semi-final |
| 2010 | MI | 14 | 10 | 20 | Final |
| 2011 | RCB | 14 | 9 | 18 | Final |
| 2012 | DC | 16 | 11 | 22 | Semi-final |
| 2013 | CSK | 16 | 11 | 22 | Final |
| 2014 | PBKS | 14 | 11 | 22 | Final |
| 2015 | CSK | 14 | 9 | 18 | Final |
| 2016 | GL | 14 | 9 | 18 | Playoffs |
| 2017 | MI | 14 | 10 | 20 | Champions |
| 2018 | SRH | 14 | 9 | 18 | Final |
| 2019 | MI | 14 | 9 | 18 | Champions |
| 2020 | MI | 14 | 9 | 18 | Champions |
| 2021 | DC | 14 | 10 | 20 | Playoffs |
| 2022 | GT | 14 | 10 | 20 | Champions |
| 2023 | GT | 14 | 10 | 20 | Final |
| 2024 | KKR | 14 | 9 | 20 | Champions |
| 2025 | PBKS | 14 | 9 | 19 | Final |
| 2026 | RCB | 14 | 9 | 18 | Champions |
Now let’s go deeper into each season and see exactly how each team’s campaign unfolded.
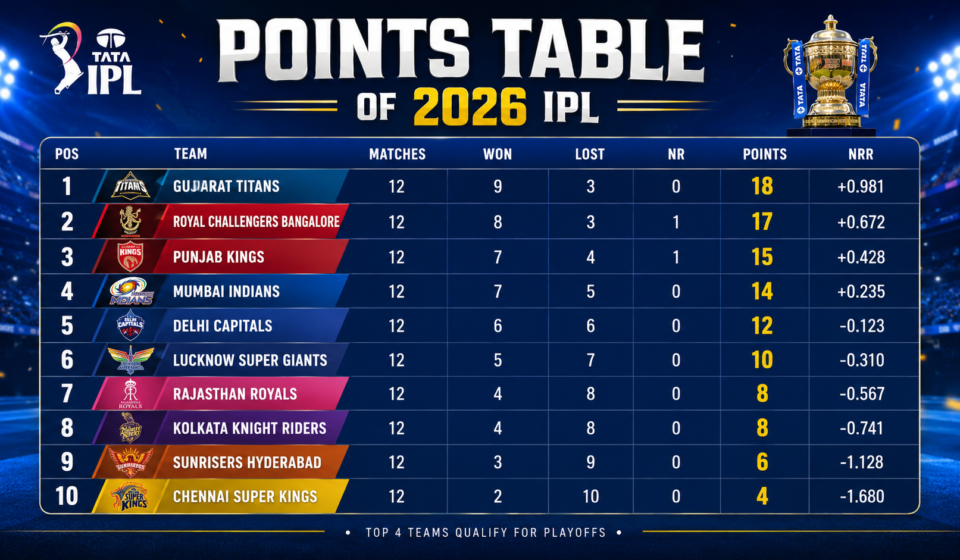
1. IPL 2026 Points Table
| Pos | Team | M | W | L | NR | NRR | Pts |
| 1 | RCB | 14 | 9 | 5 | 0 | +0.783 | 18 |
| 2 | GT | 14 | 9 | 5 | 0 | +0.695 | 18 |
| 3 | SRH | 14 | 9 | 5 | 0 | +0.524 | 18 |
| 4 | RR | 14 | 8 | 6 | 0 | +0.189 | 16 |
| 5 | PBKS | 14 | 7 | 6 | 1 | +0.309 | 15 |
| 6 | DC | 14 | 7 | 7 | 0 | -0.651 | 14 |
| 7 | KKR | 14 | 6 | 7 | 1 | -0.147 | 13 |
| 8 | CSK | 14 | 6 | 8 | 0 | -0.345 | 12 |
| 9 | MI | 14 | 4 | 10 | 0 | -0.584 | 8 |
| 10 | LSG | 14 | 4 | 10 | 0 | -0.740 | 8 |
2. IPL 2025 Points Table
| Pos | Team | M | W | L | NR | NRR | Pts |
| 1 | PBKS | 14 | 9 | 4 | 1 | +0.372 | 19 |
| 2 | RCB | 14 | 9 | 4 | 1 | +0.301 | 19 |
| 3 | GT | 14 | 9 | 5 | 0 | +0.254 | 18 |
| 4 | MI | 14 | 8 | 6 | 0 | +1.142 | 16 |
| 5 | DC | 14 | 7 | 6 | 1 | +0.011 | 15 |
| 6 | SRH | 14 | 6 | 7 | 1 | -0.241 | 13 |
| 7 | LSG | 14 | 6 | 8 | 0 | -0.376 | 12 |
| 8 | KKR | 14 | 5 | 7 | 2 | -0.305 | 12 |
| 9 | RR | 14 | 4 | 10 | 0 | -0.549 | 8 |
| 10 | CSK | 14 | 4 | 10 | 0 | -0.647 | 8 |
RCB and PBKS ended the league stage tied at 19 points apiece, which made for an unusually tense run-in to the playoffs. Mumbai Indians’ excellent net run rate of +1.142 helped them sneak into fourth place even after six defeats, while both CSK and RR slipped out of contention with just 8 points each.
RCB went on to claim their very first IPL title in dramatic fashion, edging out PBKS by a slender 6 runs in the final. It capped off a season where the franchise had finally addressed its long-running bowling problems. On the flip side, CSK’s 10-defeat campaign turned out to be among the bleakest in the club’s history.
3. IPL 2024 Points Table
| Pos | Team | M | W | L | NR | NRR | Pts |
| 1 | KKR | 14 | 9 | 3 | 2 | +1.428 | 20 |
| 2 | SRH | 14 | 8 | 5 | 1 | +0.414 | 17 |
| 3 | RR | 14 | 8 | 5 | 1 | +0.273 | 17 |
| 4 | RCB | 14 | 7 | 7 | 0 | +0.459 | 14 |
| 5 | CSK | 14 | 7 | 7 | 0 | +0.392 | 14 |
| 6 | DC | 14 | 7 | 7 | 0 | -0.377 | 14 |
| 7 | LSG | 14 | 7 | 7 | 0 | -0.667 | 14 |
| 8 | GT | 14 | 5 | 7 | 2 | -1.063 | 12 |
| 9 | PBKS | 14 | 5 | 9 | 0 | -0.353 | 10 |
| 10 | MI | 14 | 4 | 10 | 0 | -0.318 | 8 |
KKR controlled the league stage from start to finish, posting a remarkable +1.428 net run rate before going on to lift the trophy. SRH and RR rounded out the top three, while MI endured one of its toughest seasons, finishing dead last with only four wins.
This title marked KKR’s third overall, and arguably their most dominant campaign yet — Shreyas Iyer’s leadership combined a relentless pace attack with an equally fearless batting unit to overwhelm the rest of the league. SRH, meanwhile, played some of the most entertaining cricket of the season under Daniel Vettori, even though it ultimately wasn’t enough to win the final.
4. IPL 2023 Points Table
| Pos | Team | M | W | L | NR | NRR | Pts |
| 1 | GT | 14 | 10 | 4 | 0 | +0.809 | 20 |
| 2 | CSK | 14 | 8 | 5 | 1 | +0.652 | 17 |
| 3 | LSG | 14 | 8 | 5 | 1 | +0.284 | 17 |
| 4 | MI | 14 | 8 | 6 | 0 | -0.044 | 16 |
| 5 | RR | 14 | 7 | 7 | 0 | +0.148 | 14 |
| 6 | RCB | 14 | 7 | 7 | 0 | +0.135 | 14 |
| 7 | KKR | 14 | 6 | 8 | 0 | -0.239 | 12 |
| 8 | PBKS | 14 | 6 | 8 | 0 | -0.304 | 12 |
| 9 | DC | 14 | 5 | 9 | 0 | -0.808 | 10 |
| 10 | SRH | 14 | 4 | 10 | 0 | -0.590 | 8 |
For the second year running, Gujarat Titans finished on top of the table with 20 points. CSK and LSG filled out the remaining playoff spots, while DC and SRH both ended the season at the bottom with just 8 points each.
It was CSK who walked away with the trophy this time, beating GT in a rematch of the previous year’s final to claim a fifth title for the franchise. Even though GT once again topped the league stage — proof that Ashish Nehra had assembled one of the most structured squads in the competition — they fell agonisingly short when the title was on the line.
5. IPL 2022 Points Table
| Pos | Team | M | W | L | NR | NRR | Pts |
| 1 | GT | 14 | 10 | 4 | 0 | +0.316 | 20 |
| 2 | RR | 14 | 9 | 5 | 0 | +0.298 | 18 |
| 3 | LSG | 14 | 9 | 5 | 0 | +0.251 | 18 |
| 4 | RCB | 14 | 8 | 6 | 0 | -0.253 | 16 |
| 5 | DC | 14 | 7 | 7 | 0 | +0.204 | 14 |
| 6 | PBKS | 14 | 7 | 7 | 0 | +0.126 | 14 |
| 7 | KKR | 14 | 6 | 8 | 0 | +0.146 | 12 |
| 8 | SRH | 14 | 6 | 8 | 0 | -0.379 | 12 |
| 9 | CSK | 14 | 4 | 10 | 0 | -0.203 | 8 |
| 10 | MI | 14 | 4 | 10 | 0 | -0.506 | 8 |
This was the year the IPL grew to a ten-team format, with 74 matches played for the first time ever. Remarkably, Gujarat Titans — playing their very first season in the league — finished on top of the table and went on to win the title, arguably the most stunning debut season the IPL has ever seen.
CSK and MI, both five-time champions before this season, ended up rooted to the bottom of the table. RR, on the other hand, reached an IPL final for the first time since their title-winning debut season back in 2008, only to fall to GT’s pace-driven bowling attack.
6. IPL 2021 Points Table
| Pos | Team | M | W | L | NR | NRR | Pts |
| 1 | DC | 14 | 10 | 4 | 0 | +0.481 | 20 |
| 2 | CSK | 14 | 9 | 5 | 0 | +0.455 | 18 |
| 3 | RCB | 14 | 9 | 5 | 0 | -0.140 | 18 |
| 4 | KKR | 14 | 7 | 7 | 0 | +0.587 | 14 |
| 5 | MI | 14 | 7 | 7 | 0 | +0.116 | 14 |
| 6 | PBKS | 14 | 6 | 8 | 0 | -0.001 | 12 |
| 7 | RR | 14 | 5 | 9 | 0 | -0.993 | 10 |
| 8 | SRH | 14 | 3 | 11 | 0 | -0.545 | 6 |
Delhi Capitals topped the points table for the first time in their franchise’s history, finishing the league stage with 20 points. CSK bounced back impressively from a poor 2020 campaign to finish second, and that resurgence eventually carried them all the way to the title.
Stephen Fleming’s CSK side looked the most balanced version of the team in years en route to their fourth championship. SRH, by contrast, endured their worst-ever season with just three wins. DC’s table-topping run remained the high point of their campaign — they reached the final, lost to KKR, and then watched CSK lift the trophy.
7. IPL 2020 Points Table
| Pos | Team | M | W | L | NR | NRR | Pts |
| 1 | MI | 14 | 9 | 5 | 0 | +1.107 | 18 |
| 2 | DC | 14 | 8 | 6 | 0 | -0.109 | 16 |
| 3 | SRH | 14 | 7 | 7 | 0 | +0.608 | 14 |
| 4 | RCB | 14 | 7 | 7 | 0 | -0.172 | 14 |
| 5 | KKR | 14 | 7 | 7 | 0 | -0.214 | 14 |
| 6 | PBKS | 14 | 6 | 8 | 0 | -0.162 | 12 |
| 7 | CSK | 14 | 6 | 8 | 0 | -0.455 | 12 |
| 8 | RR | 14 | 6 | 8 | 0 | -0.569 | 12 |
This entire season was held in the UAE because of the COVID-19 pandemic. MI led the table from start to finish and went on to claim their fifth title. DC reached their first final since 2004, and SRH secured third place thanks to a healthy net run rate.
MI’s back-to-back titles in 2019 and 2020 confirmed their status as the most dominant dynasty the IPL has ever produced. DC’s run to the final felt like a genuine turning point for the franchise, even though they ultimately lost to MI. The neutral UAE conditions made for an unusually tight mid-table, with only a single point separating the teams ranked third through eighth.
8. IPL 2019 Points Table
| Pos | Team | M | W | L | NR | NRR | Pts |
| 1 | MI | 14 | 9 | 5 | 0 | +0.421 | 18 |
| 2 | CSK | 14 | 9 | 5 | 0 | +0.131 | 18 |
| 3 | DC | 14 | 9 | 5 | 0 | +0.044 | 18 |
| 4 | SRH | 14 | 6 | 8 | 0 | +0.577 | 12 |
| 5 | KKR | 14 | 6 | 8 | 0 | +0.028 | 12 |
| 6 | PBKS | 14 | 6 | 8 | 0 | -0.251 | 12 |
| 7 | RR | 14 | 5 | 8 | 1 | -0.449 | 11 |
| 8 | RCB | 14 | 5 | 8 | 1 | -0.607 | 11 |
MI finished on top of the table and went on to lift a record fourth title. CSK and DC also made it into the top three. RCB, on the other hand, finished eighth and missed out on the playoffs entirely.
Three teams — MI, CSK, and DC — all finished level on 18 points, leaving net run rate to decide the final order. MI then beat CSK in the final, a result that had become almost predictable by this stage. DC’s nine wins finally showed the kind of potential the franchise had been chasing for years.
9. IPL 2018 Points Table
| Pos | Team | M | W | L | NR | NRR | Pts |
| 1 | SRH | 14 | 9 | 5 | 0 | +0.284 | 18 |
| 2 | CSK | 14 | 9 | 5 | 0 | +0.253 | 18 |
| 3 | KKR | 14 | 8 | 6 | 0 | -0.070 | 16 |
| 4 | RR | 14 | 7 | 7 | 0 | -0.250 | 14 |
| 5 | MI | 14 | 6 | 8 | 0 | +0.317 | 12 |
| 6 | RCB | 14 | 6 | 8 | 0 | +0.129 | 12 |
| 7 | PBKS | 14 | 6 | 8 | 0 | -0.502 | 12 |
| 8 | DC | 14 | 5 | 9 | 0 | -0.222 | 10 |
SRH topped the table under Kane Williamson’s leadership. CSK, returning after a two-year suspension, finished second and went on to win their third title.
CSK’s comeback campaign was nothing short of remarkable — straight back into the final, and straight to the trophy. SRH’s strong league-stage form under Williamson couldn’t be converted into silverware, as CSK got the better of them in the final. RR and DC, also returning from their own two-year bans, had relatively mixed seasons.
10. IPL 2017 Points Table
| Pos | Team | M | W | L | NR | NRR | Pts |
| 1 | MI | 14 | 10 | 4 | 0 | +0.784 | 20 |
| 2 | RPS | 14 | 9 | 5 | 0 | +0.176 | 18 |
| 3 | SRH | 14 | 8 | 5 | 1 | +0.599 | 17 |
| 4 | KKR | 14 | 8 | 6 | 0 | +0.641 | 16 |
| 5 | PBKS | 14 | 7 | 7 | 0 | -0.009 | 14 |
| 6 | DC | 14 | 6 | 8 | 0 | -0.512 | 12 |
| 7 | GL | 14 | 4 | 10 | 0 | -0.412 | 8 |
| 8 | RCB | 14 | 3 | 10 | 1 | -1.299 | 7 |
MI finished the league stage on 20 points and claimed their third title, beating Rising Pune Supergiant in the final. RPS, in their short-lived existence, recorded the best finish they ever managed.
RCB had one of the toughest seasons in their history, scraping together just 7 points from 14 matches. MI’s table-topping run was about as complete as it gets. Meanwhile, KKR’s net run rate of +0.641, despite finishing fourth, showed how fiercely contested the middle of the table really was that year.
11. IPL 2016 Points Table
| Pos | Team | M | W | L | NR | NRR | Pts |
| 1 | GL | 14 | 9 | 5 | 0 | -0.374 | 18 |
| 2 | RCB | 14 | 8 | 6 | 0 | +0.932 | 16 |
| 3 | SRH | 14 | 8 | 6 | 0 | +0.245 | 16 |
| 4 | KKR | 14 | 8 | 6 | 0 | +0.106 | 16 |
| 5 | MI | 14 | 7 | 7 | 0 | -0.146 | 14 |
| 6 | DC | 14 | 7 | 7 | 0 | -0.155 | 14 |
| 7 | RPS | 14 | 5 | 9 | 0 | +0.015 | 10 |
| 8 | PBKS | 14 | 4 | 10 | 0 | -0.646 | 8 |
This season introduced Gujarat Lions to the competition as a replacement franchise. SRH claimed their first-ever title, even though GL had actually topped the league stage on their debut — a sign of things to come for GT’s own debut win in 2022.
SRH’s maiden championship arrived despite finishing only third in the league stage. RCB’s net run rate of +0.932 ranks among the best in IPL history, fuelled largely by Virat Kohli’s record-breaking 973-run season. PBKS, meanwhile, had one of their weakest seasons yet, finishing with just 8 points.
12. IPL 2015 Points Table
| Pos | Team | M | W | L | NR | NRR | Pts |
| 1 | CSK | 14 | 9 | 5 | 0 | +0.709 | 18 |
| 2 | MI | 14 | 8 | 6 | 0 | -0.043 | 16 |
| 3 | RCB | 14 | 7 | 5 | 2 | +1.037 | 16 |
| 4 | RR | 14 | 7 | 5 | 2 | +0.062 | 16 |
| 5 | KKR | 14 | 7 | 6 | 1 | +0.253 | 15 |
| 6 | SRH | 14 | 7 | 7 | 0 | -0.239 | 14 |
| 7 | DC | 14 | 5 | 8 | 1 | -0.049 | 11 |
| 8 | PBKS | 14 | 3 | 11 | 0 | -1.436 | 6 |
CSK topped the table and went on to win their fourth title — their last triumph before the two-year suspension that followed. MI reached the final but came away empty-handed. RCB’s third-place finish came with an outstanding net run rate of +1.037.
CSK’s title defence that year, following wins in 2010 and 2011, marked one of the most dominant stretches the league has seen. PBKS’s net run rate of -1.436, paired with just 6 points, remains one of the poorest single-season performances by any franchise. RCB’s strong NRR showed off their batting depth, even though it never translated into silverware.
13. IPL 2014 Points Table
| Pos | Team | M | W | L | NR | NRR | Pts |
| 1 | PBKS | 14 | 11 | 3 | 0 | +0.968 | 22 |
| 2 | KKR | 14 | 9 | 5 | 0 | +0.418 | 18 |
| 3 | CSK | 14 | 9 | 5 | 0 | +0.385 | 18 |
| 4 | MI | 14 | 7 | 7 | 0 | +0.095 | 14 |
| 5 | RR | 14 | 7 | 7 | 0 | +0.060 | 14 |
| 6 | SRH | 14 | 6 | 8 | 0 | -0.399 | 12 |
| 7 | RCB | 14 | 5 | 9 | 0 | -0.428 | 10 |
| 8 | DC | 14 | 2 | 12 | 0 | -1.182 | 4 |
PBKS finished the league stage with a record 22 points, joint-highest at that point in IPL history — only to fall short in the final against KKR. It remains one of the league’s great near-misses.
DC’s campaign, ending with just 4 points and 12 losses, is still remembered as one of the worst in the competition’s history. PBKS’s 11 wins in the league stage were genuinely extraordinary, yet the heartbreak of losing the final continues to define that franchise’s story. For KKR, this title was their second in just three seasons.
14. IPL 2013 Points Table
| Pos | Team | M | W | L | NR | NRR | Pts |
| 1 | CSK | 16 | 11 | 5 | 0 | +0.530 | 22 |
| 2 | MI | 16 | 11 | 5 | 0 | +0.441 | 22 |
| 3 | RR | 16 | 10 | 6 | 0 | +0.322 | 20 |
| 4 | SRH | 16 | 10 | 6 | 0 | +0.003 | 20 |
| 5 | RCB | 16 | 9 | 7 | 0 | +0.457 | 18 |
| 6 | PBKS | 16 | 8 | 8 | 0 | +0.226 | 16 |
| 7 | KKR | 16 | 6 | 10 | 0 | -0.095 | 12 |
| 8 | PWI | 16 | 4 | 12 | 0 | -1.006 | 8 |
| 9 | DC | 16 | 3 | 13 | 0 | -0.848 | 6 |
The season’s format expanded to 16 matches per team this year. CSK and MI ended the league stage level on 22 points each, in a season that saw both established giants at their dominant best, before MI claimed their second title overall.
SRH made their league debut this season, finishing fourth. MI beat CSK in the final — a clash between the two league-stage toppers. DC’s three-win campaign was, at the time, the worst record in their history, while Pune Warriors India’s final season in the league ended with only four wins before the franchise was eventually shut down.
15. IPL 2012 Points Table
| Pos | Team | M | W | L | NR | NRR | Pts |
| 1 | DC | 16 | 11 | 5 | 0 | +0.617 | 22 |
| 2 | KKR | 16 | 10 | 5 | 1 | +0.561 | 21 |
| 3 | MI | 16 | 10 | 6 | 0 | -0.100 | 20 |
| 4 | CSK | 16 | 8 | 7 | 1 | +0.100 | 17 |
| 5 | RCB | 16 | 8 | 7 | 1 | -0.022 | 17 |
| 6 | PBKS | 16 | 8 | 8 | 0 | -0.216 | 16 |
| 7 | RR | 16 | 7 | 9 | 0 | +0.201 | 14 |
| 8 | DCH | 16 | 4 | 11 | 1 | -0.509 | 9 |
| 9 | PWI | 16 | 4 | 12 | 0 | -0.551 | 8 |
DC led the table with 22 points under Virender Sehwag’s captaincy that year. However, it was KKR who ultimately walked away with their maiden IPL title. The tournament also expanded to nine teams with the addition of Pune Warriors India.
KKR’s first-ever championship, secured under Gautam Gambhir, came even though they had finished second in the league stage. DC’s 22-point league-stage finish remains their best regular-season performance to date — a title, though, has continued to elude them despite that kind of consistency.
16. IPL 2011 Points Table
| Pos | Team | M | W | L | NR | NRR | Pts |
| 1 | RCB | 14 | 9 | 4 | 1 | +0.326 | 19 |
| 2 | CSK | 14 | 9 | 5 | 0 | +0.443 | 18 |
| 3 | MI | 14 | 9 | 5 | 0 | +0.040 | 18 |
| 4 | KKR | 14 | 8 | 6 | 0 | +0.433 | 16 |
| 5 | PBKS | 14 | 7 | 7 | 0 | -0.051 | 14 |
| 6 | RR | 14 | 6 | 7 | 1 | -0.691 | 13 |
| 7 | DCH | 14 | 6 | 8 | 0 | +0.222 | 12 |
| 8 | KTK | 14 | 6 | 8 | 0 | -0.214 | 12 |
| 9 | PWI | 14 | 4 | 9 | 1 | -0.134 | 9 |
| 10 | DC | 14 | 4 | 9 | 1 | -0.448 | 9 |
RCB finished the league stage on top with 19 points in what was one of their best-ever seasons. CSK and MI also booked their playoff spots. RCB went on to reach the final once again, but lost — their second final defeat in three years.
CSK secured back-to-back titles by beating RCB in that final. Kochi Tuskers Kerala played their only-ever IPL season before being shut down. DC finished tenth that year, their worst campaign up to that point, managing just 9 points.
17. IPL 2010 Points Table
| Pos | Team | M | W | L | NR | NRR | Pts |
| 1 | MI | 14 | 10 | 4 | 0 | +1.084 | 20 |
| 2 | DCH | 14 | 8 | 6 | 0 | -0.297 | 16 |
| 3 | CSK | 14 | 7 | 7 | 0 | +0.274 | 14 |
| 4 | RCB | 14 | 7 | 7 | 0 | +0.219 | 14 |
| 5 | DC | 14 | 7 | 7 | 0 | +0.021 | 14 |
| 6 | KKR | 14 | 7 | 7 | 0 | -0.341 | 14 |
| 7 | RR | 14 | 6 | 8 | 0 | -0.514 | 12 |
| 8 | PBKS | 14 | 4 | 10 | 0 | -0.478 | 8 |
MI topped the table for the first time, finishing with 20 points. Deccan Chargers came in second. CSK, RCB, and DC all squeezed into the playoffs in what turned out to be a closely fought season.
CSK ended up winning their first IPL title, beating MI in the final and avenging their third-place league-stage finish. MI’s outstanding +1.084 net run rate wasn’t enough to prevent that final-day defeat. PBKS, meanwhile, posted just 8 points — among the weakest returns by a top-eight side in those early seasons.
18. IPL 2009 Points Table
| Pos | Team | M | W | L | NR | NRR | Pts |
| 1 | DC | 14 | 10 | 4 | 0 | +0.311 | 20 |
| 2 | CSK | 14 | 8 | 5 | 1 | +0.951 | 17 |
| 3 | RCB | 14 | 8 | 6 | 0 | -0.191 | 16 |
| 4 | DCH | 14 | 7 | 7 | 0 | +0.203 | 14 |
| 5 | PBKS | 14 | 7 | 7 | 0 | -0.483 | 14 |
| 6 | RR | 14 | 6 | 7 | 1 | -0.352 | 13 |
| 7 | MI | 14 | 5 | 8 | 1 | +0.297 | 11 |
| 8 | KKR | 14 | 3 | 10 | 1 | -0.789 | 7 |
This entire season was played in South Africa because of the Indian general elections, making it the only IPL season ever held outside the country. DC topped the league stage that year.
DC went on to win their first and, so far, only IPL title, defeating RCB in the final. Deccan Chargers, led by Adam Gilchrist, made it to the playoffs after finishing fourth. KKR’s 7 points were among the lowest tallies of that early era, while CSK’s remarkable +0.951 net run rate stood out despite their second-place finish.
19. IPL 2008 Points Table
| Pos | Team | M | W | L | NR | NRR | Pts |
| 1 | RR | 14 | 11 | 3 | 0 | +0.632 | 22 |
| 2 | PBKS | 14 | 10 | 4 | 0 | +0.509 | 20 |
| 3 | CSK | 14 | 8 | 6 | 0 | -0.192 | 16 |
| 4 | DC | 14 | 7 | 6 | 1 | +0.342 | 15 |
| 5 | MI | 14 | 7 | 7 | 0 | +0.570 | 14 |
| 6 | KKR | 14 | 6 | 7 | 1 | -0.147 | 13 |
| 7 | RCB | 14 | 4 | 10 | 0 | -1.160 | 8 |
| 8 | DCH | 14 | 2 | 12 | 0 | -0.467 | 4 |
The very first IPL season. Rajasthan Royals finished on top with 22 points and went on to win the inaugural title, setting the blueprint that every season since has tried to follow.
Shane Warne’s Rajasthan Royals were the original underdog story — a franchise with a modest budget that outsmarted nearly every rival to win the title in style. RCB’s 8-point debut foreshadowed the long, difficult road that lay ahead for them over the next seventeen seasons. Meanwhile, Deccan Chargers’ 4-point finish from 14 matches still stands as the lowest points tally recorded by any team in a completed IPL season.
Conclusion: MI and CSK Remain the League’s Most Consistent Franchises
Looking back across every IPL points table since 2008, one thing becomes clear — Mumbai Indians and Chennai Super Kings have built the most consistent legacies in the league, each picking up five titles along the way. Kolkata Knight Riders aren’t too far behind, having established themselves as one of the league’s premier franchises with three championships of their own.
Royal Challengers Bengaluru’s back-to-back titles in 2025 and 2026 are a reminder of just how quickly fortunes can turn in this league. Gujarat Titans, similarly, made history by winning the trophy in the very first season they ever played.
As the tournament keeps growing year after year, the points table remains the clearest measure of a team’s consistency through the grind of the league stage. Still, as every single IPL season has proven time and again, it’s the teams that handle pressure best in the playoffs who end up lifting the trophy.